Contact us if you need consultation with SAP LUMIRA dashboard / visualization development.
SAP Lumira is a data visualization and story creation tool. You can connect to multiple data sources to create datasets that can be enhanced with measures, hierarchies, calculations, and customized columns. A wide range of editing tools allow you to manipulate, edit, format, and streamline your data before you start to create graphical visualizations.
In this free SAP Lumira Training you can visualize your data using a range of chart and table types. By grouping charts together on presentation style dashboards you can create a visual narrative to describe your data. SAP Lumira is installed locally and can operate on either remote or local data. The charts built on these datasets can be printed or distributed by email.
You can visualize your data using a range of chart and table types. By grouping charts together on presentation style dashboards you can create a visual narrative to describe your data. SAP Lumira is installed locally and can operate on either remote or local data. The charts built on these datasets can be printed or distributed by email.
Your stories can be published to the SAP Business Intelligence platform. Your datasets can be published to SAP HANA, SAP Explorer, and SAP Business Intelligence. Datasets and their charts that are created in SAP Lumira are saved in documents with the file format .lums. This is a document that contains the data source connection information, the data definition and data, and the visualizations. ENJOY SAP LUMIRA TRAINING
-

View captions and translations for tutorial videos: SAP.com/LearnBI
The video versions of many SAP business intelligence tutorials include accurate text captions that can bet translated into a number of languages. This tutorial shows how to enable and translate the text captions for a tutorial. -
What's new in SAP Lumira 1.28
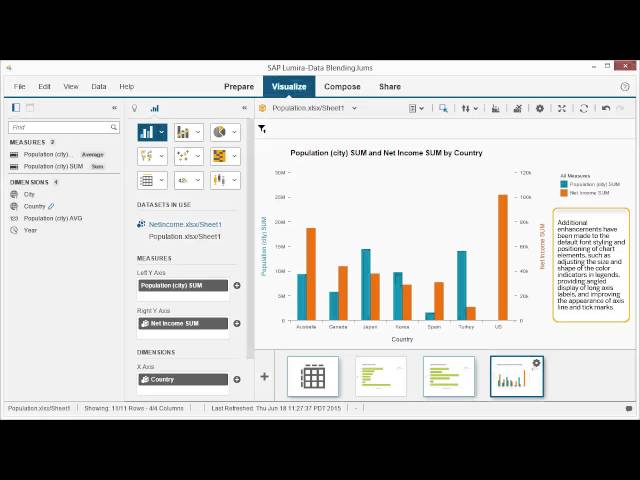
A number of new features have been introduced in the latest release of SAP Lumira to improve usability. In this video, we will review these features.
Visit us at http://www.sap.com/LearnBI to view our full catalog of interactive SAP BusinessObjects BI Suite tutorials. -
What's new in SAP Lumira 1.27
A number of new features have been introduced in the latest release of SAP Lumira to improve usability. In this video, we will review these features.
Visit us at http://www.sap.com/LearnBI to view our full catalog of interactive SAP BusinessObjects BI Suite tutorials. -
What's new in SAP Lumira 1.25
A number of new features have been introduced in the latest release of SAP Lumira to improve usability. In this video, we will review these features.
Visit us at http://www.sap.com/LearnBI to view our full catalog of interactive SAP BusinessObjects BI Suite tutorials. -

What's new in SAP Lumira 1.23
Several new features have been introduced in SAP Lumira 1.23. In this video, we'll review these features.
Visit us at http://www.sap.com/LearnBI to view our full catalog of interactive SAP BusinessObjects BI Suite tutorials. -
What's new in SAP Lumira 1.22
Several new features have been introduced in SAP Lumira 1.21. In this video, we'll review these features.
Visit us at http://www.sap.com/LearnBI to view our full catalog of interactive SAP BusinessObjects BI Suite tutorials. -

What's new in SAP Lumira 1.21
Several new features have been introduced in SAP Lumira 1.21. In this video, we'll review these features.
Visit us at http://www.sap.com/LearnBI to view our full catalog of interactive SAP BusinessObjects BI Suite tutorials. -
What's New in SAP Lumira 1.20
Several new features have been introduced in SAP Lumira 1.20. In this video, we'll review these features.
Visit us at http://www.sap.com/LearnBI to view our full catalog of interactive SAP BusinessObjects BI Suite tutorials. -

What's New in SAP Lumira 1.19
Several new features have been introduced in SAP Lumira 1.19. In this video, we'll review these features.
Visit us at http://www.sap.com/LearnBI to view our full catalog of interactive SAP BusinessObjects BI Suite tutorials. -
What's new in SAP Lumira 1.18
A number of new features have been introduced in the latest release of SAP Lumira to improve usability. In this tutorial, we will review these features.
Visit us at http://www.sap.com/LearnBI to view our full catalog of interactive SAP BusinessObjects BI Suite tutorials. -
What's new in SAP Lumira 1.17
A number of new features have been introduced in the latest release of SAP Lumira to improve usability. In this video, we'll review these features.
Visit us at http://www.sap.com/LearnBI to view our full catalog of interactive SAP BusinessObjects BI Suite tutorials. -

Navigate the interface: SAP Lumira 1.17
SAP Lumira is a desktop application that's designed to make it easy to acquire, visualize, and share data. In this tutorial, we'll take a quick look at the interface.
Visit us at http://www.sap.com/LearnBI to view our full catalog of interactive SAP BusinessObjects BI Suite tutorials. -

Register for an SAP Lumira Cloud account: SAP Lumira 1.17
From the SAP Lumira Cloud landing page, we can register for an account, which provides 1GB of free storage in which we can upload and explore data. In this tutorial, we'll create a new account for SAP Lumira Cloud.
Visit us at http://www.sap.com/LearnBI to view our full catalog of interactive SAP BusinessObjects BI Suite tutorials. -

Set up an SAP Lumira Cloud Enterprise account for a team: SAP Lumira 1.17
An SAP Lumira Cloud Enterprise Edition account enables us to share our content with team members by providing five licenses and 5GBs of shared storage. In this tutorial, we'll activate an Enterprise account.
Visit us at http://www.sap.com/LearnBI to view our full catalog of interactive SAP BusinessObjects BI Suite tutorials. -

Upload a file to SAP Lumira Cloud or SAP Lumira Server: SAP Lumira 1.17
SAP Lumira Cloud and SAP Lumira Server can be used to store documents for download by other team members and users. In this tutorial, we’ll upload an SAP Lumira document.
Visit us at http://www.sap.com/LearnBI to view our full catalog of interactive SAP BusinessObjects BI Suite tutorials. -

Create a user account in SAP Lumira Edge Server: SAP Lumira 1.22
As super users or administrators of SAP Lumira Edge Server, we can create new user accounts and manage licenses. In this example, we’ll create a new administrative account for a named user.
Visit us at http://www.sap.com/LearnBI to view our full catalog of interactive SAP BusinessObjects BI Suite tutorials. -
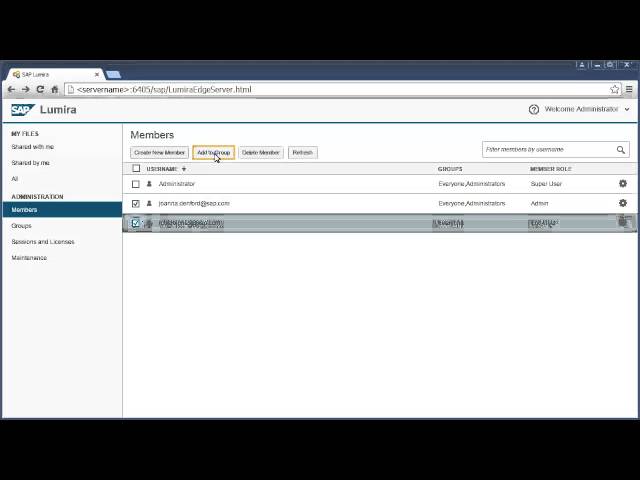
Create a user group in SAP Lumira Cloud or SAP Lumira Edge Server: SAP Lumira 1.22
We can create groups in SAP Lumira Cloud and SAP Lumira Edge Server for subsets of users. In this example, we’ll create a Management group.
Visit us at http://www.sap.com/LearnBI to view our full catalog of interactive SAP BusinessObjects BI Suite tutorials. -

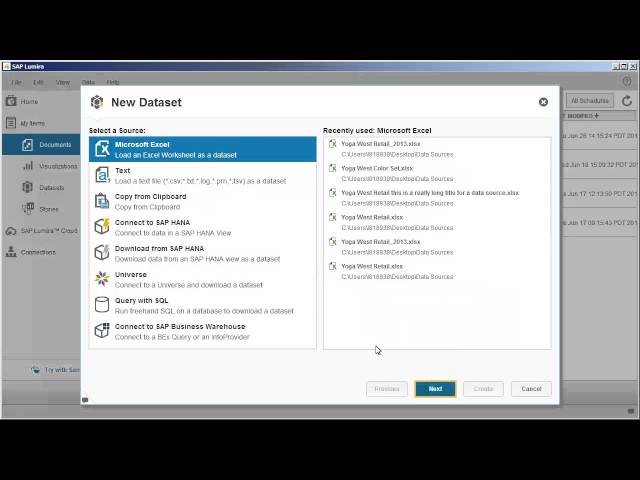
Create a document and acquire a dataset from a Microsoft Excel file: SAP Lumira 1.17
The first step to exploring data in SAP Lumira is to create a document and acquire a dataset from a data source. In this tutorial, we'll acquire a dataset based on a local Microsoft Excel file.
Visit us at http://www.sap.com/LearnBI to view our full catalog of interactive SAP BusinessObjects BI Suite tutorials. -
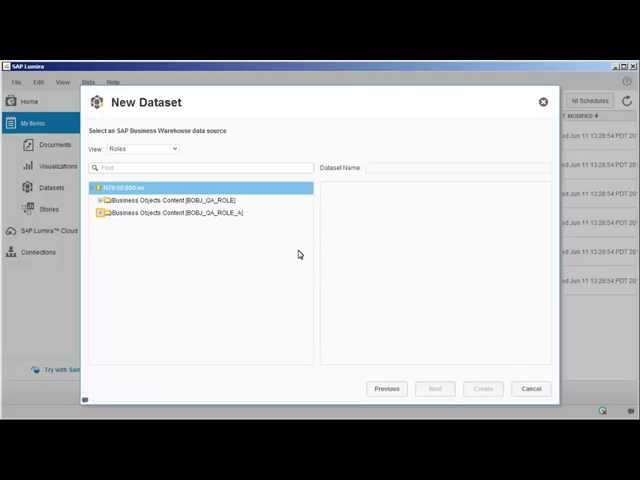
Acquire a dataset from SAP BW: SAP Lumira 1.17
SAP Lumira now supports limited exploration of connections to SAP BW. In this video, we'll create a new document based on an SAP BW query.
Visit us at http://www.sap.com/LearnBI to view our full catalog of interactive SAP BusinessObjects BI Suite tutorials. -

Copy data from the clipboard: SAP Lumira 1.17
We can acquire data from non-database sources by copying data to our clipboard. In this video, we'll import data that is presented in tabular format on a web site.
Visit us at http://www.sap.com/LearnBI to view our full catalog of interactive SAP BusinessObjects BI Suite tutorials. -

Acquire a dataset from an SAP HANA analytic view: SAP Lumira 1.17
SAP Lumira supports both online and offline connections to SAP HANA. In this video, we'll create a new document based on an SAP HANA analytic view using the online connection.
Visit us at http://www.sap.com/LearnBI to view our full catalog of interactive SAP BusinessObjects BI Suite tutorials. -
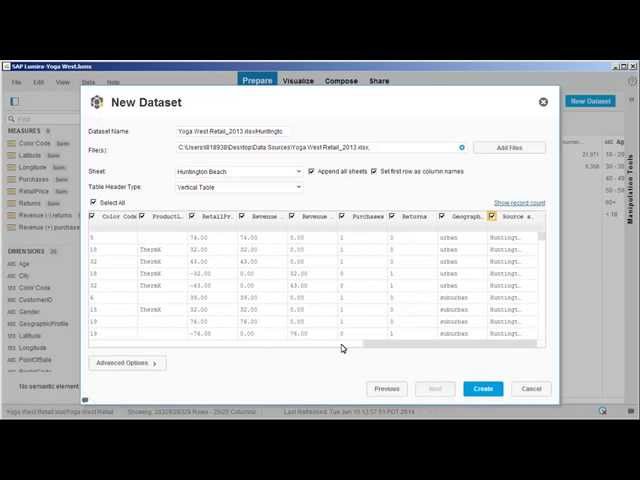
Acquire a dataset from a Microsoft Excel file with multiple worksheets: SAP Lumira 1.17
SAP Lumira enables us to consolidate multiple sheets from a Microsoft Excel spreadsheet into a single dataset. In this video, we'll add a dataset that is broken down into multiple sheets by Point of Sale area.
Visit us at http://www.sap.com/LearnBI to view our full catalog of interactive SAP BusinessObjects BI Suite tutorials. -

Acquire a dataset from a universe: SAP Lumira 1.17
Provided we are running an SAP BusinessObjects Business Intelligence platform, we can generate datasets out of queries based on universe objects. In this video, we'll add a dataset for a universe that contains customer survey information.
Visit us at http://www.sap.com/LearnBI to view our full catalog of interactive SAP BusinessObjects BI Suite tutorials. -

Install data access drivers: SAP Lumira 1.17
For non-standard data source types, we need to install the appropriate data drivers in the application preferences. In this video, we'll install the drivers for Microsoft SQL Server 2008.
Visit us at http://www.sap.com/LearnBI to view our full catalog of interactive SAP BusinessObjects BI Suite tutorials. -

Acquire a dataset from a database using Freehand SQL: SAP Lumira 1.17
We can connect to SQL data sources directly, rather than going through queries and semantic layers. In this video, we'll create a dataset for a SQL Server database lookup table.
Visit us at http://www.sap.com/LearnBI to view our full catalog of interactive SAP BusinessObjects BI Suite tutorials. -

Combine datasets by appending records from a dataset with the same structure: SAP Lumira 1.17
We can combine datasets in a document by appending records from one to another, provided both datasets have the same structure. In this video, we'll append the sales records for one year to the dataset for another year.
Visit us at http://www.sap.com/LearnBI to view our full catalog of interactive SAP BusinessObjects BI Suite tutorials. -

Combine datasets by merging on a shared column: SAP Lumira 1.17
We can combine datasets in a document by merging the datasets on a shared column. In this video, we'll merge records for multiple datasets.
Visit us at http://www.sap.com/LearnBI to view our full catalog of interactive SAP BusinessObjects BI Suite tutorials. -
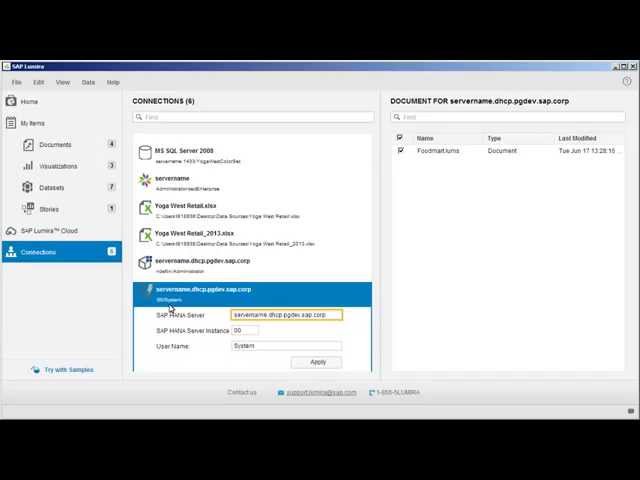
Manage connections and associated documents: SAP Lumira 1.17
From the sidebar, we can access the Connections page, which we can use to view and edit all the connections defined between documents and data sources. In this video, we'll point an existing connection to a new SAP HANA server.
Visit us at http://www.sap.com/LearnBI to view our full catalog of interactive SAP BusinessObjects BI Suite tutorials. -
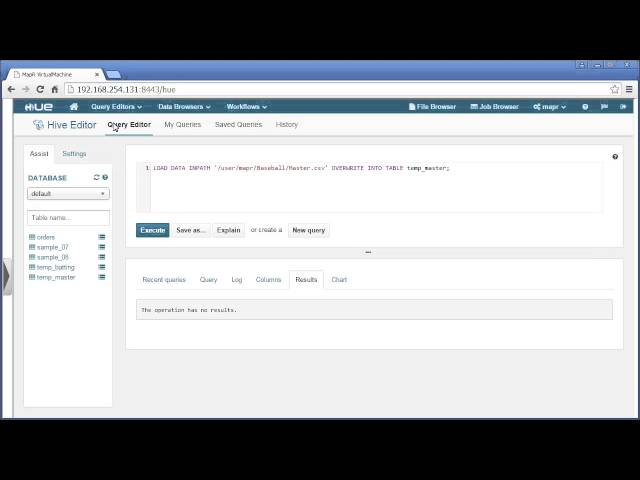
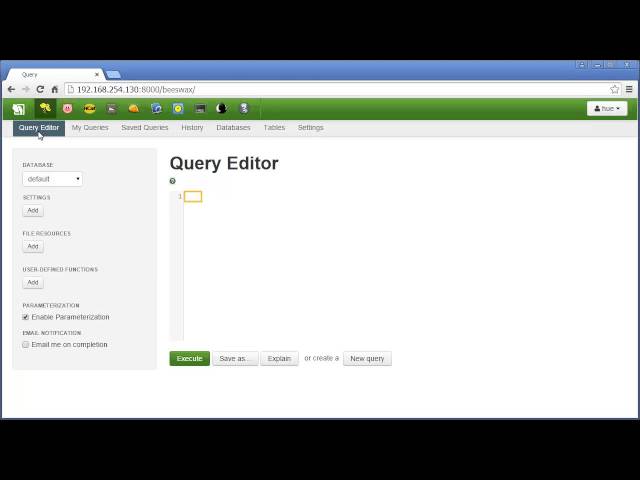
Connect to MapR Sandbox for Hadoop: SAP Lumira 1.25
MapR provides a Sandbox environment that we can use as a data source within SAP Lumira to explore big data. In this example, we will download the Sandbox for Hadoop from the MapR web site and configure it for use with SAP Lumira.
Visit us at http://www.sap.com/LearnBI to view our full catalog of interactive SAP BusinessObjects BI Suite tutorials. -
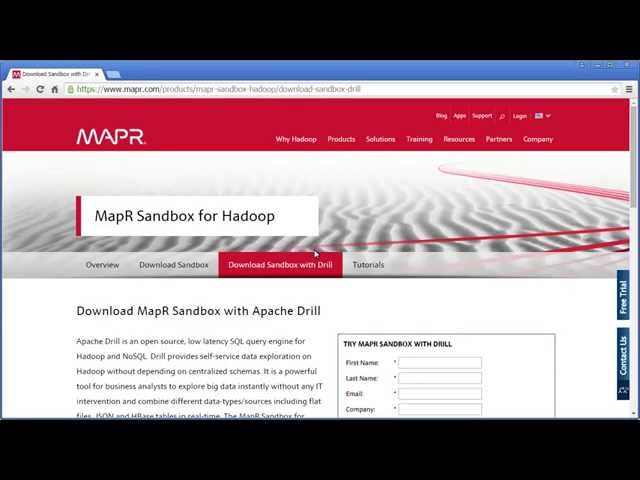
Connect to MapR Sandbox with Apache Drill: SAP Lumira 1.25
MapR provides Sandbox environments that we can use as data sources within SAP Lumira to explore big data. In this example, we will download the MapR Sandbox with Apache Drill from the MapR web site and configure it for use with SAP Lumira.
Visit us at http://www.sap.com/LearnBI to view our full catalog of interactive SAP BusinessObjects BI Suite tutorials. -
Connect to Hortonworks Sandbox: SAP Lumira 1.21
Hortonworks provides a Sandbox environment that we can use as a data source within SAP Lumira to explore big data. In this example, we’ll download the Sandbox from the Hortonworks web site and configure it for use with SAP Lumira.
Visit us at http://www.sap.com/LearnBI to view our full catalog of interactive SAP BusinessObjects BI Suite tutorials. -

Create a dataset based on a Microsoft Excel file directly online: SAP Lumira 1.17
In SAP Lumira Cloud and SAP Lumira Server, we can create a new dataset directly from the My Items page. In this tutorial, we'll create a dataset for the Best Run Corporation retail data.
Visit us at http://www.sap.com/LearnBI to view our full catalog of interactive SAP BusinessObjects BI Suite tutorials. -
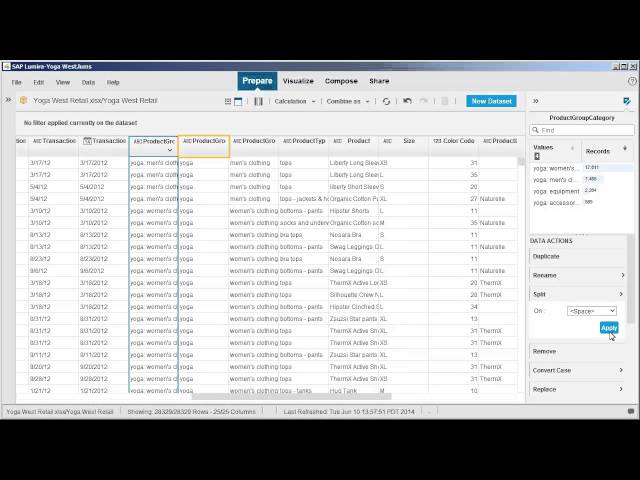
Edit and cleanse a dataset: SAP Lumira 1.17
We can edit a dataset after it's been acquired, which enables us to keep current with changes to the underlying data sources. In this tutorial, we'll edit and cleanse a dataset.
Visit us at http://www.sap.com/LearnBI to view our full catalog of interactive SAP BusinessObjects BI Suite tutorials. -
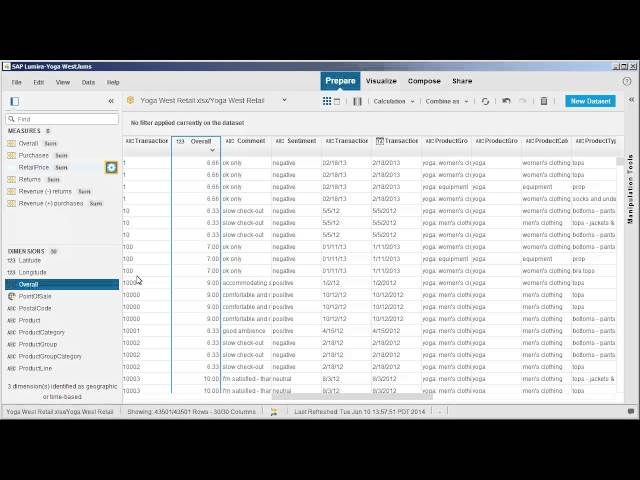
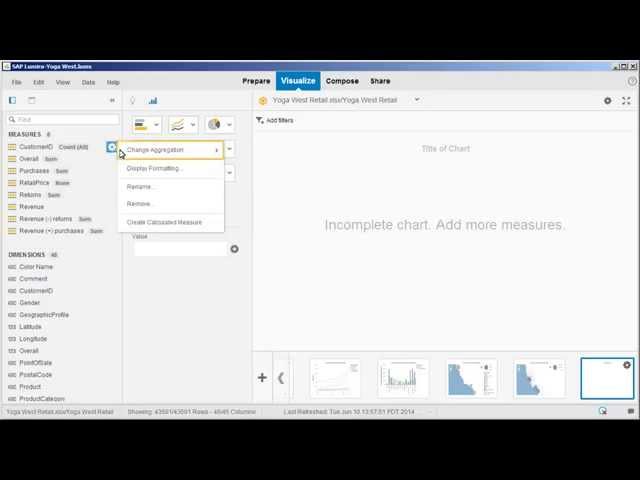
Manage measures in a dataset: SAP Lumira 1.17
We can modify the measures in our datasets by removing them, promoting them from dimensions, and changing their aggregation method. In this tutorial, we'll manage the measures in a dataset.
Visit us at http://www.sap.com/LearnBI to view our full catalog of interactive SAP BusinessObjects BI Suite tutorials. -
Create a time hierarchy: SAP Lumira 1.17
Time dimensions can be semantically enriched to create time hierarchies that include year, quarter, month, and day information. In this tutorial, we'll create a time hierarchy based on an existing date.
Visit us at http://www.sap.com/LearnBI to view our full catalog of interactive SAP BusinessObjects BI Suite tutorials. -

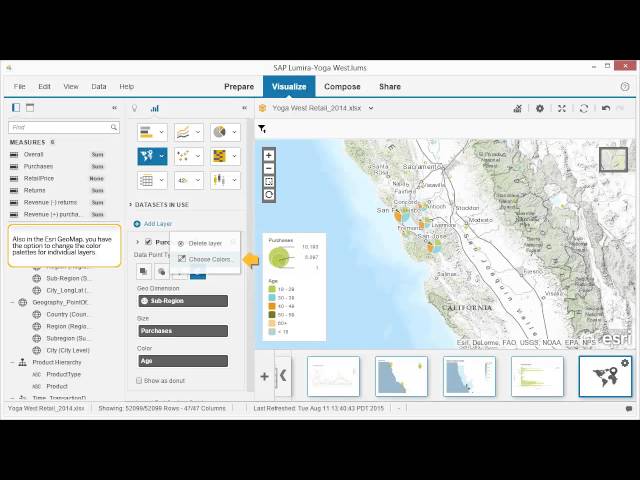
Create a geographic hierarchy based on location names: SAP Lumira 1.17
Geographical hierarchies that allow us to drill down into the country, state, subregion, and city data can be created based on either location names or latitude and longitude. In this tutorial, we'll create a geographic hierarchy based on location names.
Visit us at http://www.sap.com/LearnBI to view our full catalog of interactive SAP BusinessObjects BI Suite tutorials. -

Create a geographic hierarchy based on latitude and longitude: SAP Lumira 1.17
Geographical hierarchies that allow us to drill down into the country, state, subregion, and city data can be created based on either location names or latitude and longitude. In this tutorial, we'll create a geographic hierarchy based on latitude and longitude.
Visit us at http://www.sap.com/LearnBI to view our full catalog of interactive SAP BusinessObjects BI Suite tutorials. -
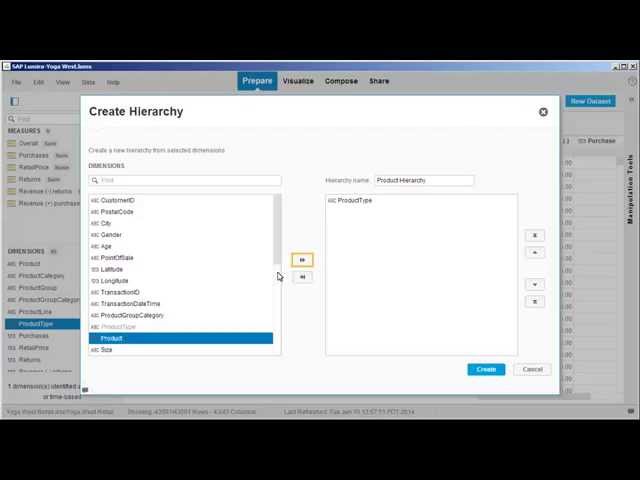
Create a custom hierarchy: SAP Lumira 1.17
If our data contains other hierarchies that are not time or geography-related, we can create custom hierarchies to capture these relationships. In this tutorial, we'll create a custom hierarchy for the product type and product dimensions.
Visit us at http://www.sap.com/LearnBI to view our full catalog of interactive SAP BusinessObjects BI Suite tutorials. -

Create a calculated measure or dimension in a dataset: SAP Lumira 1.17
We can create new calculated measures in our dataset using formulas based on existing measures. In this tutorial, we'll create a calculated measure for revenue by subtracting revenue for returns from revenue for purchases.
Visit us at http://www.sap.com/LearnBI to view our full catalog of interactive SAP BusinessObjects BI Suite tutorials. -
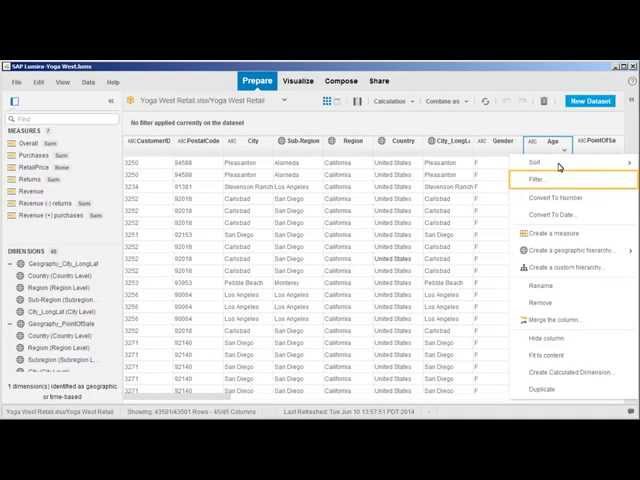
Sort and filter values in a dataset: SAP Lumira 1.17
We can sort and filter the values in our dataset to better highlight specific values. In this tutorial, we'll apply sorts and filters to see how they affect our visualizations.
Visit us at http://www.sap.com/LearnBI to view our full catalog of interactive SAP BusinessObjects BI Suite tutorials. -

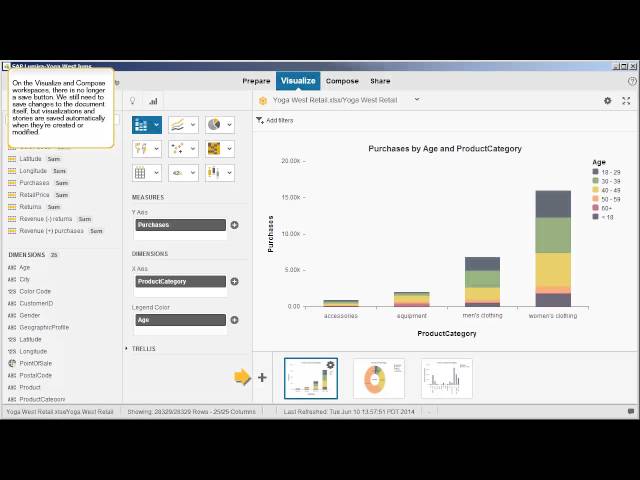
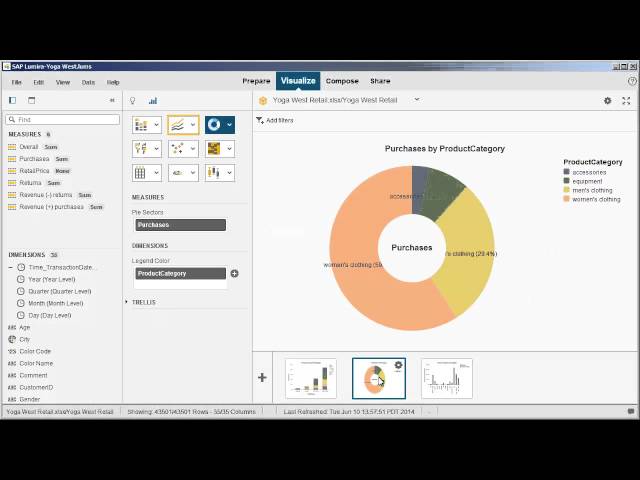
Build visualizations: SAP Lumira 1.17
Once we have acquired and cleansed our dataset, we can start building visualizations based on the data. In this tutorial, we'll create several visualizations for our document.
Visit us at http://www.sap.com/LearnBI to view our full catalog of interactive SAP BusinessObjects BI Suite tutorials. -

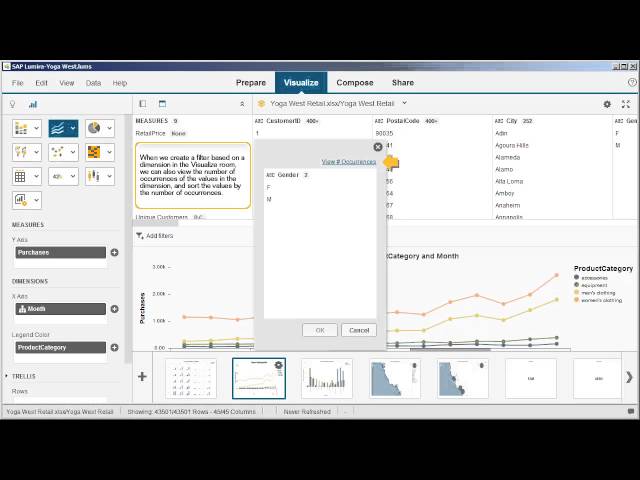
Sort, rank, calculate, and filter values in a visualization: SAP Lumira 1.17
In the Visualize workspace, we can make adjustments to the measures and dimensions that have already been added to a visualization. In this video, we'll apply sorts, ranks, calculations, and filters.
Visit us at http://www.sap.com/LearnBI to view our full catalog of interactive SAP BusinessObjects BI Suite tutorials. -

Create a trellis effect in a visualization: SAP Lumira 1.17
We can create a trellis effect to divide our visualization into multiple charts for each member in a particular dimension. In this video, we'll change the visualization to show multiple charts based on age group and quarter.
Visit us at http://www.sap.com/LearnBI to view our full catalog of interactive SAP BusinessObjects BI Suite tutorials. -
Display a single measure in a visualization: SAP Lumira 1.17
The Numeric Point chart type enables us to display a single measure, which can be very useful in stories and infographics. In this vdeo, we'll create a new measure to show a count of unique customers, and then display it in a chart.
Visit us at http://www.sap.com/LearnBI to view our full catalog of interactive SAP BusinessObjects BI Suite tutorials. -
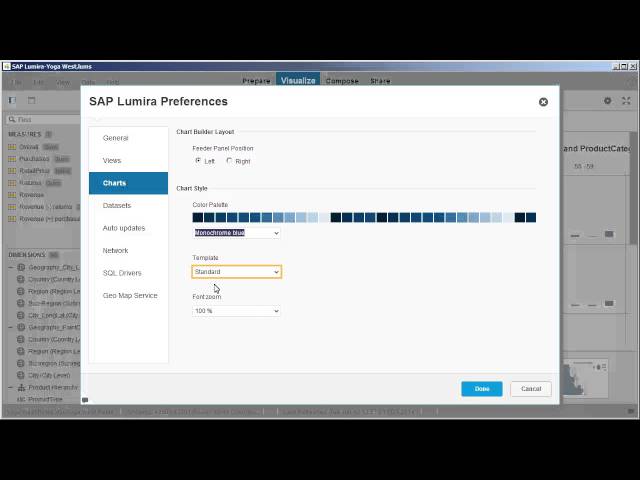
Change chart formatting for all visualizations: SAP Lumira 1.17
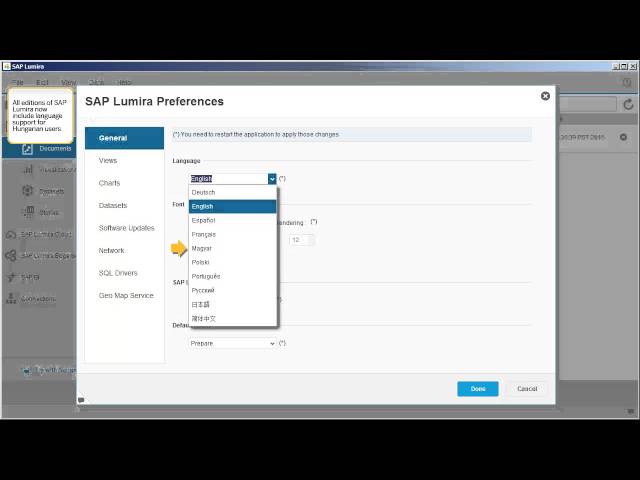
We can change chart formatting globally using our program preferences. In this video, we'll change the color palette, template, and font zoom for all visualizations.
Visit us at http://www.sap.com/LearnBI to view our full catalog of interactive SAP BusinessObjects BI Suite tutorials. -
Use a custom HTML5 chart extension: SAP Lumira 1.17
We can use chart extensions to expand the available chart types in SAP Lumira. In this video, we'll review where extensions are located, and then create a new document and visualization based on the flag bar chart extension.
Visit us at http://www.sap.com/LearnBI to view our full catalog of interactive SAP BusinessObjects BI Suite tutorials. -

Create a story: SAP Lumira 1.17
Once we have created visualizations, we can combine them into storyboards that group the information in a meaningful way. In this tutorial, we'll create a story with multiple elements.
Visit us at http://www.sap.com/LearnBI to view our full catalog of interactive SAP BusinessObjects BI Suite tutorials. -
Add pictures to an infographic: SAP Lumira 1.17
In addition to simple boards, we can now create more complex stories in the form of infographics, which can be constructed from a combination of pictures, shapes, visualizations, pictograms, and text objects. In this video, we'll create a new infographic and add background and logo images.
Visit us at http://www.sap.com/LearnBI to view our full catalog of interactive SAP BusinessObjects BI Suite tutorials. -
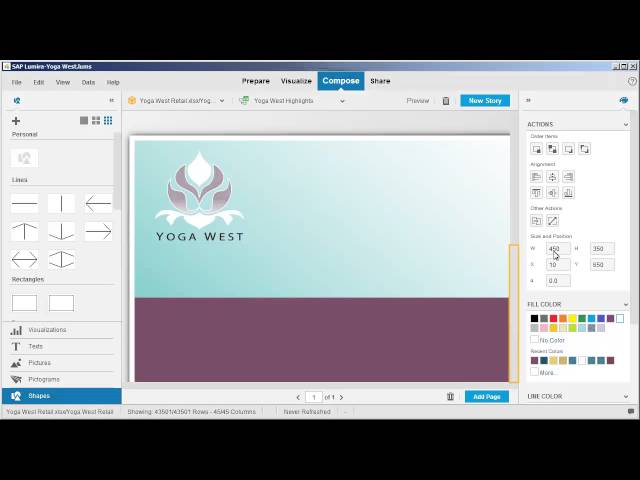
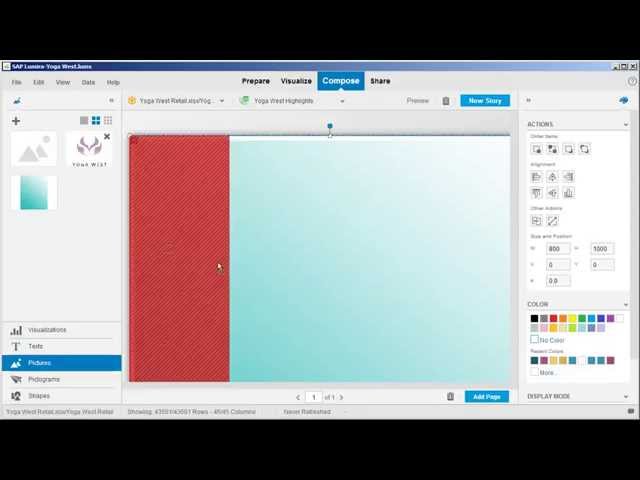
Add shapes to an infographic: SAP Lumira 1.17
We can create more visual interest in our infographic by using shapes. In this video, we'll add and configure several overlapping shapes to create panels.
Visit us at http://www.sap.com/LearnBI to view our full catalog of interactive SAP BusinessObjects BI Suite tutorials. -
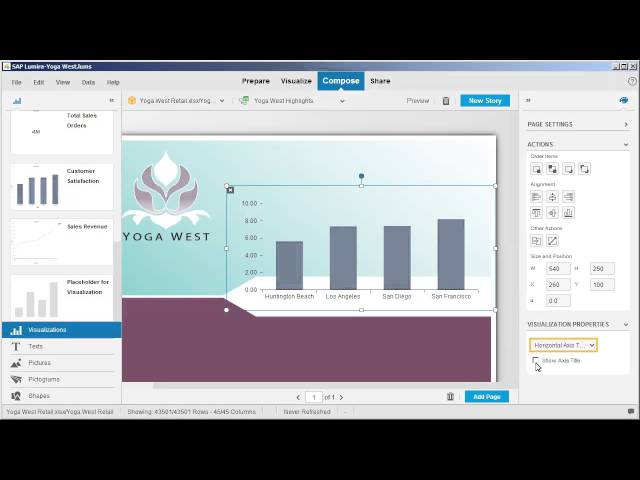
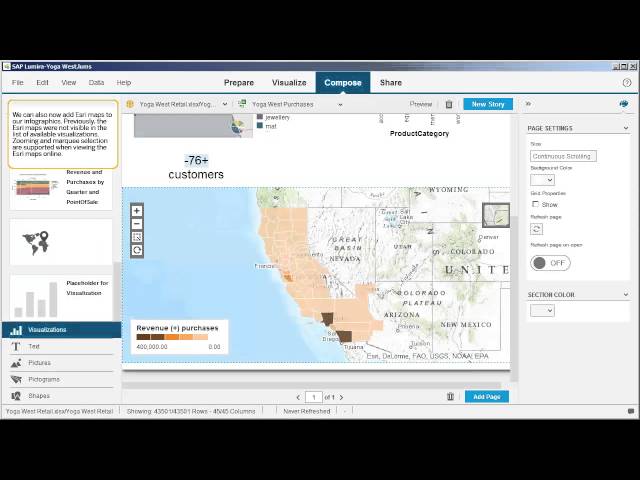
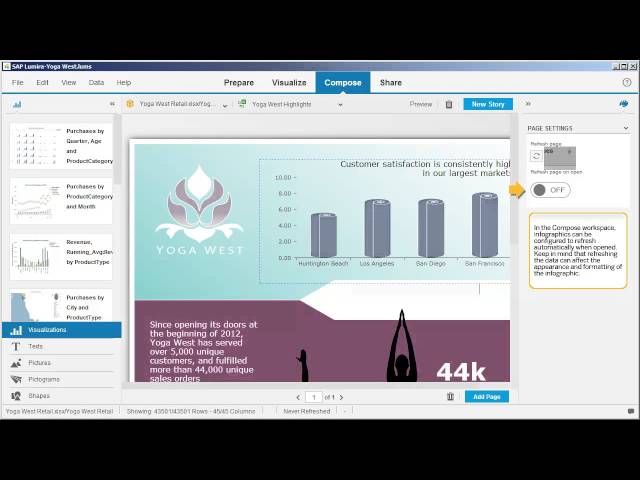
Add visualizations to an infographic: SAP Lumira 1.17
Once the layout for our infographic has been defined, we can add visualizations to present key findings. In this video, we'll add several different types of visualizations and modify their properties.
Visit us at http://www.sap.com/LearnBI to view our full catalog of interactive SAP BusinessObjects BI Suite tutorials.
The playlist identified with the request's playlistId parameter cannot be found.